Friday, August 3, 2018

Voters in 2016 asked for a Democratic Senate by the highest margin in decades. They didn't get one.

The United States Senate is an unusual place. Unlike the House of Representatives, known as the "People's House," the Senate was designed to reflect the sovereign interests of the states themselves, rather than the people living in them. (Prior to the adoption of the 17th Amendment in 1913, in most states, the people didn't even get to weigh in on the Senators representing them; they were selected by state legislatures.) By assigning two Senate seats to each state, regardless of population, the framers intended to balance the interests of smaller states with those of larger ones.

These concerns remain valid today, as less populated states now tend to be largely rural, and more populated states more urbanized, affecting their legislative interests in important ways. Nonetheless, modern circumstances have skewed the impact of this initial compromise. For one thing, the disparity in population between the smallest and largest states has grown drastically, giving small states immense power in the Senate relative to their population. Additionally, the move to popular election of Senators - and the expansion of voting rights to all adult citizens, rather than land-owning white males - has led to an expectation that the Congress ought to be more responsive to the people's wishes.

Measuring the people's preferences on a national level, however, has always been tricky when it comes to the Senate. Unlike House or Presidential elections, the nation doesn't all vote at once, giving us tidy popular vote totals that we can compare to the actual results (in House seats or Presidential electoral votes). Senate seats are divided into three classes, serving staggered six-year terms, and only two-thirds of the states have a Senate race in any given election year, so the popular vote from one election cycle cannot be held to represent the wishes of the nation as a whole.

We can gain a better understanding, however, by combining the votes from the most recent election of each Senate seat, over the last three election cycles. This ensures that each voter is counted equally in the totals, regardless of the state they live in. It has the added advantage of including two data points from each state (one for each Senate seat), usually from two points in time. This will smooth out some of the outlier effects from wave elections, as well as the effects of candidates who are far more popular in their state than their party. (For example, a West Virginian who votes for Democrat Joe Manchin isn't necessarily doing so because they want Chuck Schumer to be Majority Leader, though they may be contributing to that. But the same state's votes for Republican Shelley Moore Capito will cancel out some of that dissonance.)

To determine the Aggregate Popular Vote - let's call it APV for short - for the current Senate, we would total up the votes from the November 2012 election (for all Class I seats), November 2014 (for all Class II seats except for Alabama's), and November 2016 (for all Class III seats), as well as the December 2017 special election for Alabama's Class II seat. This reveals a huge disparity between the votes and the result:

Democratic
Votes
Republican
Votes
Independent/3rd
Party/Other
MarginDem SeatsRep SeatsFloor Margin
121,741,009102,034,2439,152,897D+8.46%4751R+4

Even when you include Angus King and Bernie Sanders, the two Independent Senators who caucus with the Democrats, Republicans control the chamber with a two-seat advantage, despite the voters' preference for Democrats by a wide margin. That margin should be viewed with a very large asterisk, though, which I will explain further on.

This lopsided victory for Republicans is not an unusual situation, given the outsized power and predominantly conservative politics of the smaller, more rural states. I have collected historical election results that allow us to determine the APV of the Senate at any point since 1987. (In order to capture the effects of special elections, appointments, and Senators who changed party affiliation during their terms - but only weight these events by the amount of time they were in effect - I've followed the trends of APV on a month-by-month basis, rather than just every two years.) Over the 31 years from 1987 to 2018, Democrats have received a plurailty of the APV a whopping 94% of the time, but have only controlled the chamber (even including Independents caucusing with them) 56% of the time. The APV has only favored Republicans for two years, 1999-2000, out of the entire 31-year period.

The Republican structural advantage is such that, over the last three decades, Republicans have controlled the Senate with a losing APV 38% of the time, but Democrats have never won control after losing the APV.

But the lopsided result of the 2016 electionwould seem to far exceed even these historical trends. The average APV since 1987 has been in favor of the Democratic Party by a 2.94% margin. The APV margin after the 2016 election was D+8.13%, a record high during the period we have data for. It increased slightly, to D+8.46%, with the 2017 special election victory of Doug Jones in Alabama.

How did the margin increase so heavily toward Democrats in a year that overall went so poorly for them? A major part of it was the races for the large, liberal states of California and New York, which had higher than usual turnout. California, in particular, was able to run up the tallies because of their peculiar "jungle primary" election system. During the primary election, all candidates are listed on the same ballot, regardless of party, and the top two vote-getters go on to the general election. In 2016, the top two candidates in the primary were both Democrats, and faced each other in November - meaning that no Republican appeared on the ballot, and every vote cast was for a Democrat. Other Senate elections in past years have occurred where one major party did not field a candidate - more often with a Republican running unopposed than a Democrat - but never in a state as populous as California.

To isolate that effect, we need to estimate what the APV would be if a Republican had appeared on the California ballot. In the 2016 California primary, twelve Republican candidates received a combined 28.6% of the vote, while seven Democrats received 64.1% (with 7.3% going to other candidates and write-ins). If we assume that the general election would have mirrored those results, had the ballot included a Republican and independent candidate, we would see Democrats receive about 4.4 million fewer votes, with Republicans taking 3.5 million of them. This would drop the nationwide APV margin to D+4.73% (rising to D+5.07% after the 2017 special election).

Those theoretical margins are much closer to the usual trendline, though they are still well above average. It is also a significant swing towards Democrats compared to the pre-2016 APV (which favored Democrats by only 2.09%), and the highest margin ever in favor of Democrats in a time when Republicans still controlled the chamber. Prior to 2015, Republicans had never won control while losing the APV by more than 1.17%.

Those interested can view the data used to calculate the APV.

Sunday, November 12, 2017

What just happened in Virginia?

Tuesday's elections in the Virginia House of Delegates cannot be described as anything other than a wave. The Republican Party, previously one seat shy of a two-thirds supermajority, saw their advantage nearly eliminated by Democratic challengers. The total popular vote over all districts, which favored Republicans in 2015 by a 26% margin, swung to a 9% Democratic margin in 2017.

As of November 12, the election results suggest a Republican lead in 51 of the 100 districts. In four of those districts, the Republican lead is less than 1%, triggering a recount. Those recounts, as well as any provisional ballots yet to be counted, will determine which party controls the Virginia House. In one of those districts, the Republican candidate currently leads by only thirteen votes.

How likely is it that the recounts will change the results? Data from the nonpartisan electoral-reform organization FairVote suggests that the odds of a recount flipping an election's outcome is roughly three in twenty-seven. This is based on a study of statewide, not district, elections between 2000 and 2015, so it is not a perfect analogy, but it is close enough for a decent guesstimate. I ran a simulation that assumes that each recount has a 3/27 (about 11%) chance of resulting in a Democratic pickup - with the exception of the 94th district, the one with the 13-vote margin. Since that one is so close, I doubled the odds to 6/27. The actual odds may be higher, since the number of provisional ballots might significantly exceed the margin.

In order for Republicans to hold the majority, they need to retain their leads in all four districts that are being recounted. If Democrats are able to flip at least two of these districts, their party takes the majority. If only one of the recounts results in a Democratic victor, the House will be deadlocked at a 50-50 tie.

Based on the odds described above, I projected that Republicans hold a roughly 55% chance of retaining their majority by winning all four of the recounts. Democrats have about a 9% chance of gaining enough seats to take the majority. The remaining 36% of simulations resulted in a deadlocked House. You can view and re-run my simulation here, if you like.

What's most shocking about these results is that despite the fact that 53% of Virginia's voters chose Democrats, leading Republican voters by a 9% margin, Democrats only won 49% of the seats solidly. Even in recounts, they have less than a one-in-ten chance of gaining the majority, and just over a one-in-three chance of a tie, in spite of what would seem to be the clear choice of the people of Virginia.

Part of this can be explained by the number of uncontested races. In the 2015 election, when Republicans won 61% of the statewide popular vote and 66 of the 100 seats, there were a whopping 71 out of 100 contests where only one of the two major parties fielded a candidate. Of those 71 candidates who stood unopposed (or opposed only by independent, third-party or write-in candidates), 44 were Republicans and 27 were Democrats. This year, the Democrats really stepped up their candidate-recruitment game. Roughly the same number of Democrats (28) stood unopposed by Republicans in 2017, but only 12 Republicans sailed to victory without a Democratic challenger.

In fact, the advantage in uncontested races explains much of the popular-vote margin in both 2015 and 2017. Even with their depressing effects on voter turnout, these races allow one party to run up the vote tally unanswered. So in 2015, when 44 Republicans ran unopposed - nearly half the chamber - of course they won the statewide vote by a large margin. Democrats swung that advantage in their favor in 2017 by fielding more candidates without Republican efforts to do the same, so they won the popular vote this year. In fact, if you count only districts in which both a Republican and a Democrat were on the ballot this year, the Republicans won 54% of the total votes.

This would seem to challenge the narrative of a Democratic wave, but there is another factor in play. That factor is, of course, gerrymandering. Given what we've learned about the contested races, it may not seem that gerrymandering had much of an effect here. After all, Republicans won 54% of the vote in contested races, but are barely hanging on to a majority of seats and may lose it, how can we say that the districts are drawn in a way that advantages Republicans?

For one thing, in those 60 contested districts where Republicans got 54% of the vote, they hold a lead in 39 of the races (65%), showing they still hold an advantageous position based on how those districts are drawn. But more importantly, the uncontested districts are a feature, not a bug, of Virginia's gerrymandered maps. To understand this, we should discuss how gerrymandering is done. It involves two steps, often called "packing" and "cracking." The party in power "packs" as many opposition voters as they can into a few districts, giving the minority party a handful of safe seats that they will win by very wide margins. The rest of the opposition voters are "cracked" - spread as thinly as possible across the remaining districts, often drawing lines through the middle of neighborhoods in order to split them up and dilute their votes. Thus, the party drawing the maps gives themselves a larger number of safe seats than the opposition - though they will usually win those seats by smaller margins than the packed districts.

This is part of why the Democrats' candidate recruitment effort was so successful. Many of the districts where Democrats did not field a challenger in 2015 but did in 2017 are "cracked" districts, where they are at just enough of a disadvantage that they can't win in a normal year - but they could pose a serious challenge in a wave year. On the other hand, the districts where a Democrat ran unopposed are "packed" districts, where the Democratic advantage is so strong, any Republican challenger would just be throwing campaign dollars down a well. But from the Republican perspective, that's just fine. These super-safe Democratic seats give the GOP that many more opportunities to build their majorities elsewhere, and by not fielding a challenger in these packed districts, the party saves resources that they can focus on the rest of the state.

Virginia's voter turnout this year, at 47%, is the highest it has seen in a state legislative election in twenty years. Despite this, in the districts that were not contested by both major parties, 20% fewer voters came to the polls on average than in contested districts. Voters in these districts can be forgiven for believing that their vote wouldn't matter much in this election. Safely-drawn districts, particularly those featuring uncontested races, lead to reduced engagement by voters. Imagine what turnout may have been if every seat had been challenged by both major parties. Better yet, imagine if the districts weren't drawn to protect incumbents and give one party or the other a baked-in political advantage - if more districts were actually competitive.

Regardless of these challenges, the Virginia election stands as an example of how much voting really matters. Even in the face of a gerrymandered map, the people of Virginia were able to cut a Republican supermajority down to a statistical tie. And even if the GOP holds onto all 51 seats after the recounts, their slim majority will make it more difficult to pass legislation without Democratic support - and to gerrymander the next round of maps in a few years, depending on the 2019 results. But the greatest example of the power of a single vote is Virginia's 94th district. A race separated by a mere thirteen votes may determine the balance of power in the entire House of Delegates. It could have been yourself and a dozen friends; few enough people to fit in a single room, deciding the future of a state. Under the right circumstances, that is the power of the ballot.

Wednesday, November 16, 2016

Trump won in the rust belt, but the most powerful voters are in New Hampshire.

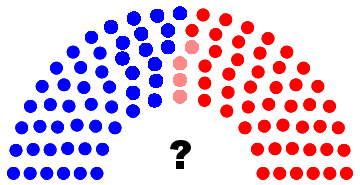
Dicussions of the Electoral College have lately been all over the news and social media, even more so than in a normal election year, in the wake of Donald Trump's lopsided victory. Though the election of Trump has been the rallying cry behind hundreds of thinkpieces and desperate petitions, there are far more oddities to the system than the possibility of winning a majority in the Electoral College while losing the popular vote, which has now happened four times in our history. Even in a "normal" election without an electoral split, the need for candidates to compete for electoral votes rather than an outright majority leads them to focus their time, money and attention on swing states, and modify their messaging and policy proposals to appeal to voters in those states. The process is also designed to give smaller states a mathematical advantage. The result is an election where some voters have far greater power than others, based on geography, to select the President.

None of this is news, but it is difficult to discuss the real extent of this power imbalance when we see it as an abstraction. Four years ago, I attempted to quantify these effects using a formula I developed, which I called the Vote Value Index. Today, I'm taking a look at the 2016 election using the same formula. I'll get into the mechanics of the formula later, but the upshot is that we're creating a list of values which we can use to compare states to each other, and easily find out how much power a state's voters have to influence the election, compared to voters in other states.

The Vote Value Index takes two factors into account that affects a voter's influence: the small-state advantage (which allows less populated states to punch above their weight in the Electoral College, and handicaps larger states), and the margin of victory (because a vote is more influential in a "swing state" with a small margin). It is important to note that we are not looking for the probability that a single voter will cast the "magic vote" that will tip the election. We are simply measuring how much power each voter has to move the needle in either direction. It's also important to note that the Vote Value Index is dynamic, and will change from one election to the next, based on the closeness of each contest as well as changes in population.

The states are listed below in order of their voters' individual power. The Vote Value Index is shown using the state with the least powerful voters (in this year's case, California) as a baseline. California's VVI is set to 1.00. All other states' VVI represents a multiple of the value of a California vote. In other words, a state with a VVI of 10.0 means that a voter in that state has ten times more influence than a voter in California. The Percent Value vs. Popular Vote is a comparison of a voter's influence under the current system to the same voter's influence if we simply used the nationwide popular vote to select the President. This is determined by dividing the state's VVI by the average VVI of all states. (Note: this data is based on unofficial returns, and may not include provisional ballots that are still being counted. The information is accurate as of November 14.)

RankingStateVote Value IndexPercent value vs.
popular vote
Rank in 20122012 value vs.
popular vote
1NH247.391,826.95%2310.59%
2MI105.83781.54%3055.85%
3WI36.62270.43%2192.40%
4ME33.07244.22%18107.38%
5MN26.17193.26%1996.77%
6NV24.63181.89%6189.95%
7PA24.43180.41%2094.63%
8FL20.29149.84%1598.73%
9AK14.14104.42%3275.09%
10RI10.5377.76%17109.68%
11DE10.2375.55%13123.16%
12NM8.8165.06%12133.48%
13VT8.6563.88%16114.38%
14AZ8.5863.36%2378.36%
15CO7.7257.01%14122.76%
16NC6.9651.40%4252.23%
17WY6.3747.04%10137.20%
18GA6.2646.23%2281.58%
19VA5.6241.50%9143.85%
20SD4.7334.93%8148.16%
21ND4.6534.34%7179.60%
22IA4.5033.23%11134.54%
23MT4.2431.31%15122.64%
24CT3.4025.11%3446.30%
25NE3.2423.93%2572.37%
26TX3.2323.85%3839.24%
27OR3.1623.34%2957.01%
28OH3.1022.89%5250.88%
29UT3.0522.52%4924.96%
30HI2.9421.71%3743.14%
31SC2.6019.20%2671.41%
32NJ2.5919.13%4137.21%
33MS2.5518.83%2473.93%
34KS2.5118.54%3644.09%
35DC2.4317.95%3153.10%
36ID2.3417.28%3346.57%
37WA1.9914.70%3545.44%
38IL1.9414.33%4233.25%
39KY1.9014.03%4429.73%
40WV1.8113.37%3249.50%
41AR1.8113.37%4037.73%
42LA1.7613.00%3937.94%
43IN1.6812.41%2860.08%
44MO1.6111.89%2760.53%
45MD1.4210.49%4725.48%
46AL1.4010.34%4332.66%
47NY1.329.75%5119.84%
48TN1.208.86%4529.71%
49MA1.128.27%4825.46%
50OK1.087.98%5022.04%
51CA1.007.38%4627.41%

Before the election, a friend of mine from high school learned that his absentee ballot had been lost in the mail. It was too close to election day to sort it out and get a replacement ballot, so he bought a last-minute plane ticket back to New Hampshire so that he could vote in person. It now seems that his beyond-the-call-of-duty trip home was quite meaningful, even if his candidate didn't win the Presidency. The state of New Hampshire had the highest VVI in the nation this year, and its voters had 247 times more influence over the election than voters in California.

Comparing the 2016 VVI with 2012 presents a bit of a challenge. I did not include the 2012 VVI in the above chart (though you can view them here), because directly comparing the VVI from two different elections is not very useful due to the changing baseline. However, looking at the top VVI for each year can show us how a very close election can widen the power imbalance. In 2012, the top VVI was Florida's 30.18 (compared to New York's 1.00, which was the 2012 baseline). This means that in 2012, the most powerful voter in the country had about 30 times more influence than the least powerful voter; in 2016, the most powerful had 247 times more than the least. This extreme imbalance comes mostly from how close the 2016 election was. In 2012, Florida was the only state with a margin of victory smaller than 1%, and only four states had margins smaller than 5%. In 2016, there were three states with margins under 1%, and a whopping eleven states were within 5%. This gave swing-state voters much greater power to influence the Electoral College, because it would have taken fewer voters to flip their state.

We can also compare the elections by the difference in a vote's value under the current system vs. a popular vote system. A percentage of more than 100% means that a state's voters have an advantage, gaining more influence through the Electoral College than they would have without it. States with less than 100% have diminished vote values due to the EC system. In 2012, there were 18 states with comparitive values over 100%; these states' voters punched above their weight, and everyone else was hamstrung. This year, only nine states held this advantage. And as this additional power narrowed into a smaller number of states this year, the magnitude of the disparity increased. The most advantaged voters in 2012 had about six times the power that they would have had under a national popular vote, while the most disadvantaged had about 20%, one-fifth, of what they would have in a popular-vote contest. This difference is nothing compared to 2016. This year, New Hampshire's voters had more than 18 times as much power as they would without the EC, while Californians had a miniscule 7% of their power under the alternative system.

I'm going to get into the nuts and bolts of the VVI formula now, so those who aren't interested in the math can feel free to skip to the end. On the other hand, if you'd like to follow along or see how your own state's VVI was calculated, you can view the full data set as a Google spreadsheet. The formula itself has three parts, shown here:

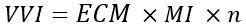
These represent an Electoral College modifier (ECM), a Margin Index (MI), and a constant (n) which sets the baseline. The first part, ECM, reflects a state's advantage or disadvantage based on their voting-eligible population (VEP) and the number of electoral votes. This represents the "small-state advantage."

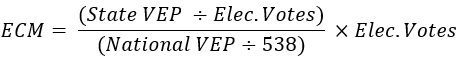
The voting-eligible population includes all of the state's residents who are U.S. citizens, at least 18 years old, and not disenfranchised due to a felony conviction or other reason. I used the 2016 estimates of VEP from the United States Elections Project. I use VEP, rather than total population or registered voters, because this is the true total number of people who could potentially cast a ballot. Ineligible residents, even though they affect the allocation of electoral votes, cannot affect the election outcome; and there is no effective difference between an eligible but unregistered person and a registered voter who doesn't show up to cast a ballot.

On average, there are 421,917 eligible voters for each electoral vote in the U.S., but because of the way the EVs are allocated, some states have more or less voters for each electoral vote. Wyoming has a population of 431,011 and three electoral votes, meaning there are only 143,670 Wyomingites per EV, giving them a far greater than average influence on the Electoral College. The formula assigns them an ECM of 8.81. Any state with an ECM higher than their number of electoral votes is a beneficiary of the small-state advantage.

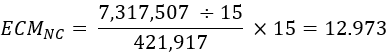
Using my own home state, North Carolina, as an example, we find an ECM of 12.973, smaller than our 15 electoral votes. This electoral handicap befits our status as the 9th most populous state in the Union.

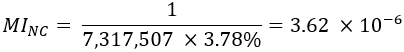
The next part of the formula is the Margin Index. This gives a boost to voters in states with close elections, particularly "swing states."

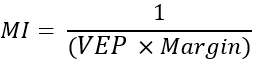
The Margin Index multiplies the VEP times the margin and then inverts it. The denominator represents the number of votes that it would take for the minority candidate to achieve a majority. The numerator of 1 represents the individual voter.

Naturally, this results in a very small number; we are measuring the influence of one voter to change the majority in an election with a large number of other voters. The MI may seem small in absolute terms, but it will be orders of magnitude higher in a close election than in a state with a runaway winner. In a moment, we'll shift these numbers into a range that we can more easily work with.

Revisiting North Carolina, we find that the MI looks like this:

The final part of the formula is a constant. The purpose of this constant is simply to apply a baseline for comparing the states. As I mentioned earlier, we want to set the state with the least powerful voters to have a VVI of 1.00. By multiplying the ECM and MI that we have so far, we find that California's presidential votes were the least influential in 2016. We get our constant by inverting California's preliminary numbers.

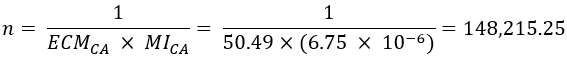
Finally, we multiply the ECM, MI, and the constant for all of the states to get the final VVI.

North Carolina's VVI is just under 7, which tells me that my vote is seven times more influential there than if I lived in California. My state dropped sharply in the rankings this year, from #4 to #16, mostly due to the change in margin; we were one of the closest states in 2012, but our margin nearly doubled in 2016. The change in value against a popular vote system was drastic, too. The Electoral College advantaged North Carolinians in 2012, making our vote roughly 2.5 times more powerful. In 2016, the EC instead handicapped us by about half.

Clearly, I am in favor of abolishing the Electoral College, regardless of where my own state stands in the rankings from year to year. You won't see me signing any petitions to try and convince 37 faithless electors to change this year's results, though. We knew the rules of this election when we started it, and for better or for worse, Donald Trump will be our next President. This doesn't mean that we need to maintain this antiquated system forever, though, and I strongly support the National Popular Vote Interstate Compact, which could be enacted through state legislatures without amending the Constitution.

Of course, there are a number of arguments that are often made in favor of the Electoral College system. I find most of these arguments, however, to be weak.

One argument is that the Electoral College gives rural states a voice that they wouldn't have under a popular vote, which would benefit large cities. The problem with this argument is that cities are going to have an advantage no matter what system we use. Candidates will never have much incentive to hold a campaign event in Spivey's Corner, NC (pop. 448), even in a swing state, because their resources are finite and there aren't many votes to be had there. However, they do have an incentive to focus on swing-state cities like Cleveland, Raleigh and Orlando, and largely ignore safe-state cities like Dallas, Boston and Salt Lake City. Even moderately-sized cities in swing states, such as Wilmington, NC, get plenty of attention from candidates. Under a popular vote, candidates would be just as likely to visit Billings, MT, which is roughly the same size as Wilmington and would allow more rural voters to have their voices heard. Of course, the campaign is one thing and the election is another; but under a popular vote, the rural voter in Montana would have more than three times the influence that they had in 2016, and would not be taking a back seat to voters in New Hampshire and other states.

Some also argue that the Electoral College places a check on the "tyranny of the majority" and could prevent a dictator from taking office. I find this argument to be preposterous. The people who are chosen to be electors in the modern era are mostly insiders and loyalists, chosen by state parties to reward them for their service to the party. Occasionally one or two might change their vote, but these "faithless electors" have never influenced the outcome of an election. Furthermore, many states have laws that could penalize or even invalidate a faithless elector's vote. A majority of electors would only risk their positions and the nation's outrage if it was very clear that a "tyrant" was looming. The electors aren't clairvoyant; they can only judge a candidate on their statements and record, the same as the rest of us. It would be audacious and premature to predict that Donald Trump will become a literal tyrant, but if the things he's said on the campaign trail aren't enough to sway the electors, what would be?

Finally, there is the idea that the Electoral College is what the founders intended, so who are we to mess with it? Naturally, I have a great deal of respect for the founders of this nation. They were visionaries who created a modern democratic system, unheard of in their time, and defended it from the greatest powers of their contemporary world. They built a Constitution that has endured for 240 years, and served as a model for democracies throughout the world. They started a wave in which democracy and freedom are now the global norm, rather than the exception. But we in America have a tendency to treat the founders as almost Biblical figures. Even great men have flaws, and so do their works. The founders were, after all, politicians. They squabbled just as much as today's politicians; they were just better at looking at the bigger picture and finding a compromise. They were just as good at kicking cans down the road, too. Some of the founders opposed slavery, and saw no place for it in a society founded on the idea that all men are created equal. Unfortunately, they didn't have enough like-minded colleagues, and they needed the southern states to buy in to keep the newborn nation from falling apart. Of course, by delaying the issue, the nation nearly fell apart anyway, four score and seven years later.

We've learned a lot in 240 years, and we value different things. In many ways, the founders prioritized the concerns of the states over the concerns of the people living in them. In the first election, only one state, Virginia, even held a popular ballot for President. The rest of the electors were chosen by state legislatures, leaving the people out of the process entirely. We didn't hold a popular vote in every state until after the Civil War.

The founders knew that they wouldn't get everything right on the first go. In fact, they called a mulligan on the original Articles of Confederation only eight years after it was ratified, and started over with a Constitution that would work better. We've made many changes since then to improve the way the nation operates. All of this follows my favorite line of the Constitution, from the Preamble: "to form a more perfect Union." Not a perfect Union; true perfection is impossible, and we can't know the needs of future Americans any more than the founders could have known ours. But a more perfect Union, one that forever strives to improve itself, never satisfied to stay ossified when there is a better way.

Monday, October 24, 2016

Unpopular Opinion: Why Congressional Term Limits are a Bad Idea

On October 22, Presidential candidate Donald Trump announced a new set of policy proposals that he hoped to accomplish in his first 100 days if elected. One of the proposals was to push a Constitutional amendment that would enact term limits for members of Congress. This idea, unlike many of Trump's controversial proposals, is one with a history of broad support among voters on both sides of the political divide. It appeals to people who feel, justifiably, that Congress is not working, and that career politicians are focused more on preserving their jobs than solving the problems facing the country. However, there are better ways to address this problem than imposing term limits; and furthermore, term-limiting members of Congress could do more harm than good.

It is easy to be cynical about Congress, especially when the last few sessions have been the least productive in history, and Congressional approval ratings are at all-time lows. However, I believe that most people who run for office do so, at least initially, out of a genuine desire to serve the public and make the nation a better place. It is true that many elected officials end up cycling out of politics and into lucrative positions in business, finance, and lobbying; however, this is not often their goal when they first decide to run. Anyone who has the skill set needed to serve in Congress can undoubtedly find a shorter and less painful path to making that kind of money. After all, serving in Congress is utterly thankless; it requires relocation or constant travel from home; the pay is not that great compared to others requiring similar skills; there's no job security; and you can expect your name to be dragged through the mud on television during each election.

In spite of this, people run for office because they feel strongly about the issues they represent, and wish to advocate for their constituents. However, no matter how idealistic they may be when they are sworn in on Day One, they find themselves on Day Two already running for reelection, and end up spending half of their time fundraising instead of working on the business of state. In order to maintain their position, eke out some influence and political space to push their agenda, and get assigned to a committee where they can sponsor some legislation, they need the support of their party's senior leadership; and that means, among other things, more fundraising - for your colleagues as well as for yourself. The more you hope to accomplish, the more time you spend on the phone with donors and bundlers, as well as lobbyists who want some consideration in return.

This is often an argument used in favor of term limits, but that won't solve the problem. If you were to limit members of the House of Representatives to, say, three terms, you would still have around two-thirds of the members running for reelection every two years. The senior members, in their third term and ineligible for reelection, would likely still spend a lot of their time campaigning for their chosen successors, as well as their party's junior members, and often for a new office for themselves elsewhere.

Trump did not mention how many terms he thinks is the proper limit, nor have most term-limit advocates, prefering to leave that decision to be negotiated in bill-drafting. The last proposal to gain traction in Congress, put forth by Rep. Bill McCollum in 1995, would limit Representatives to six terms and Senators to two terms - essentially, limiting both houses to 12 years in total. This bill did not get much support among the strongest term-limit advocates, mostly because the 12-year limit was seen as too long to make much of a difference. Most members of Congress do not serve for that long anyway; in 2015, the average length of service was 8.8 years for Representatives and 9.7 years for Senators.

What if we went whole-hog and limited members to a single term? This would solve the reelection conundrum, as no member of Congress would be eligible to run again. However, this would have a severe impact on the running of Congress. With the entire House of Representatives filled with 435 incoming freshman, there would be zero continuity of government, no momentum on issues not resolved in the previous session, and each incoming Congress would have to reinvent the wheel in terms of how they conduct business. The seniority system would be busted at last; but as imperfect as that system is, at least it is a system. Without it, each session would spend precious months determining who the leadership would be and how committees would be assigned. (Some people may even advocate for the abolition of committees, giving each member equal power to push legislation on any subject. As egalitarian as that sounds, it would result in utter chaos, given the amount of business that needs to be covered in the complex modern era.)

Most importantly, though, it would mean that 435 complete strangers would be put into a room and asked to work together to solve the most important and difficult problems in the country. Politics is a profession that is based on personal relationships. Nobody can go it alone; in order to get a bill passed, you have to negotiate and compromise, and come up with something that can get the support of more than half of Congress. That can only come by forming professional relationships with fellow members, both within your own party and across the aisle, knowing where they stand, what they want and need, and how you can convince them to support your position. It also takes the expertise of people who spend years researching and advocating for the issues they care about.

A single-term limit, of course, is an extreme case, and beyond what any serious person is advocating for. As I described earlier, however, nothing less will solve the problem that we're trying to address. If we want to get members of Congress off of the phones and back to work, our best option is to get serious about campaign finance reform, and change the lobbying rules.

Another important problem with term limits is that it can harm accountability. Voters, ideally, judge their legislators on their record, and ultimately, the voters will decide whether they deserve to be reelected. A long-serving member of Congress does not get to that point without broad support within their own district. Frequent elections are how we ensure that our Representatives are truly representing their constituents. A term-limited member, however, has no accountability to those who voted them into power, because they will never face those voters again. On the other hand, voters may be denied the right to keep a popular Representative, who has done good work for them and advocated well for the issues they care about, due to term limits.

Of course, if accountability were that easy, the approval rating of Congress would be higher than 18%. Voting out an unproductive or intransigent member, unfortunately, is more difficult than it ought to be. There has always been an incumbency advantage, but that advantage is made much stronger due to gerrymandering. By drawing district lines to favor one party over the other, and packing most of the opposing party's voters into the smallest possible number of districts, all of a state's districts are made uncompetitive. The practice is rampant, used by both parties, and has become all the more egregious in recent years. As a result, the voter advocacy organization FairVote has estimated that only 27 of the nation's 435 House seats are truly competitive this year.


Source: FairVote

Not only does this protect incumbents from being ousted, it also encourages members of Congress to be more extreme and less willing to compromise. With the general election largely a formality in many districts, an incumbent's party primary is the only real contest they will face. Thus, their party's base of primary voters is the only constituency they will be accountable to. This makes members unwilling to compromise on important issues and more likely to focus on partisan fringe issues, lest they be replaced by someone else who will. They become deaf to the concerns of their district's citizenry as a whole.

Term limits won't solve these issues, either. A party-line representative who is barred from reelection can just be replaced by another. The only way to make Congress truly accountable is to reform our redistricting process. By shifting the authority to draw district lines away from state legislatures, and into independent, bipartisan commissions, legislators would no longer be able to choose their own voters when it should be the other way around. In an ideal world, we would adopt FairVote's Fair Representation Act, forming independently-drawn, multi-member competitive districts, with Representatives selected by ranked choice voting.

Congressional term limits are simply another populist-minded, sound-bite-oriented proposal that sounds good on the surface. In practice, it doesn't address the problem it's meant to solve, and distracts from the true reforms that we need.

Thursday, March 17, 2016

The Lazy Coup: A Modest Proposal for the Obstructionist Endgame

Dear Senate Republicans:

You are no doubt being flooded with messages urging you to "do your job" and grant a hearing and vote to Judge Merrick Garland's Supreme Court nomination. I am not going to do that. As far as I can tell, your reading of the Constitution is correct. There is nothing in the "advice and consent" clause that mandates the Senate to provide that consent, or even consider it.

Of course, there is very little that the Constitution does mandate from the Senate; it enumerates powers, but does not generally say that these powers must be exercised. There is a smattering of "the Senate shall" clauses, which imply that these are mandatory. Even in these cases, however, full attendance is not required, so these mandates cannot be said to apply to any individual Senator. Furthermore, no deadlines are stated for any of these duties.

Indeed, the Senate could decide not to undertake any business at all, for the entirety of its session. This may appeal to some limited-government voters as the ultimate ideal. And if any seemingly necessary business was neglected, the Constitution does not outline any method to force the Senate's hand. The power to remove or censure a Senator rests entirely with the Senate itself.

This logic leads us to a solution to another problem you are facing. It appears that your party will soon be caught between a rock and a hard place in this year's Presidential election, with voters choosing between a Republican nominee that the GOP leadership wants nothing to do with, and a Democratic nominee that it has been trying to vilify for nearly a quarter century.

It doesn't have to be this way. The Constitution tasks the Senate with opening, tallying and certifying the electoral votes that are sent by the states. It does not, however, specifically state that this must be done before Inauguration Day. You could simply put the sealed certificates in a file drawer and sit on them for a couple of months. Come January 20th, there will officially be nobody to swear in.

Then, you simply declare a vacancy, clearing the way for Speaker Ryan to take the oath. Piece of cake.

So what if the word "coup" starts flying around in the liberal media?

Wednesday, March 9, 2016

What does it take to "secure the border?" Ask East Germany.

Immigration policy in the United States is like the weather: everyone complains about it, but nobody does anything about it. For years, Democrats and Republicans alike have floated proposals for fixing our broken system; in a few cases, they've even attempted compromise proposals that could, in a sensible democracy, be accepted begrudgingly by both sides. Of course, these proposals have all gone nowhere. Many of those who have stood in the way of progress on this issue have said that certain border-security conditions must be met before real reform could be tackled. These conditions range from the mass deportation of millions of undocumented immigrants to a steeply increased presence of border control in order to stop the incoming traffic. Yet no one who has declared that the border must be secured before reforming our immigration system has actually described what a secured border ought to look like. Perhaps we must cut illegal immigration to half its current level, or perhaps even a quarter (never mind that this has already happened). Maybe even a single illegal border crossing is unacceptable.

The most colorful precondition of the obstructionists is that a wall should be constructed on our border with Mexico. This wall (paid for by the Mexican government, no less, according to some) would be an impassible barrier that would put a definitive stop to any attempts to enter the United States without authorization.

Pictured here is probably the most secure border in history: the Berlin Wall. This wall, 96 miles long, surrounded the city of West Berlin from 1961 to 1989. The twelve-foot wall was constructed of reinforced concrete and barbed wire, and was further secured by trenches, floodlights, anti-vehicle caltrops, attack dogs, and over 300 watchtowers. Parts of the wall were built in parallel, separated by an empty hundred-meter zone known as the "death strip," where guards had a clear field of fire and would-be escapees had no opportunity for cover. The border was patrolled by ten regiments of troops.

Despite all of this security, concentrated in a relatively small area, about 5,000 people managed to escape to West Berlin over the years that the wall was in place.

In contrast, the border between the United States and Mexico is 1,954 miles long, more than twenty times the length of the West Berlin perimiter. What would it take to secure this border at an equivalent level to the Berlin Wall?

We could begin by estimating the construction cost. According to the Milwaukee Journal in 1963, the cost of building the Berlin Wall was estimated as US$25,000,000, which works out to $193.5 million in 2016 dollars. This was in one of the earlier phases of the wall; several stages of upgrades followed before it reached its peak of physical security, at additional expense. But let's assume that we built the U.S.-Mexico border wall to 1963 standards, and had a similar construction cost per mile. This would cost over $3.9 billion. Good luck sending that bill to the Mexican government.

The initial cost to build the wall, however, pales in comparison to the cost of patrolling it. To maintain troop levels equal to the East German patrols, ten regiments strong over 96 miles, I estimate that around 300,000 personnel would be required, or almost one-quarter of the active-duty U.S. Army. This troop level is equivalent to 75 modern-day Infantry Brigade Combat Teams, at a total maintenance cost of nearly $20.8 billion annually (mostly personnel costs), based on numbers from the Department of Defense's 2013 Unit Cost and Readiness report to the U.S. Congress.

Of course, none of this speaks to the moral cost of emulating the emigration policies of Cold War-era East Germany. And yet, in spite of all of our effort, an unguessable amount of people would still find a way to cross the border.

Certainly we should enforce our laws, to the extent of our reasonable ability. But perhaps we'd get better results by addressing the reasons why so many people attempt to enter the United States, even if unable to obtain legal authorization. Certainly many come to escape rampant poverty and seek economic opportunity; yet many of those who decry illegal immigration also favor isolationist trade policies, blocking changes that could improve both our own economy and those of our neighbors. Others wish to avoid the violence of drug cartels and gangs, which are propped up by a failed war on drugs. Still more are refugees from political turmoil, particularly those who pass through Mexico on their way from other nations in Central and South America, some of whose governments we have had dubious relationships with.

But never mind all of that, right? Those are all complex problems with difficult solutions, requiring nuanced policy proposals and cooperation with other countries. Much easier to just yell stuff about walls. While we're at it, we may as well build one on our border with Canada, too. We've already cleared the land for the death strips.

Friday, August 21, 2015

D.C. Statehood: How would it work, and what would it look like?

A few weeks ago, John Oliver ran an excellent segment on Last Week Tonight about the District of Columbia, and the lack of Congressional representation or local control that its residents have. Washingtonians have nominal home rule under a city government, but Congress has the final say over their laws and budget. They were not allowed to vote for President until 1961, and while they can elect a single delegate to Congress, that delegate has no vote there. One aspect that Oliver addressed was the movement to grant statehood to the District, and the reasons why it should, but won't, happen. He got one thing wrong, though, by saying that DC statehood would require a change to the U.S. Constitution. With one caveat that I'll get to shortly, there's no need for a Constitutional amendment.

The Constitution set the stage for the federal district in Article I, Section 8, which grants Congress the power "to exercise exclusive legislation in all cases whatsoever, over such District (not exceeding ten miles square) as may, by cession of particular states, and the acceptance of Congress, become the seat of the government of the United States." It doesn't say where the district should be located, or set a minimum size, only a maximum size. Arguably, it doesn't even require a district to be established; it only gives Congress the power to do so. This power was exercised under the Residence Act, with Maryland and Virginia ceding territory for the district. The portion west of the Potomac was returned to Virginia in 1847.

If Congress were inclined, they could admit New Columbia (so named by Washington voters in a 1982 state constitutional convention) into the Union without any violation of Article I, just as they retroceded territory back to Virginia. They could satisfy any need for a federal district by re-drawing the borders, shrinking the district to a bare minimum size, including the White House, Capitol Building and Supreme Court, and perhaps other federal facilities. This isn't a new idea, but if I were in charge of drawing the new district, here's how I would do it: (Edit: looks like this doesn't work on mobile browsers; click here to view as a plain image.)

If you'd like to explore the new district in Google Earth, you can download an KML file of this map.

This redrawn federal district would be about 2.65 square miles, less than 4% of the 68.3 square miles it currently covers. I've attempted to draw the borders to include not only the seats of the three branches of government, but as many other federal departments and national monuments as I could pack together adjacently, while including no permanent residential areas and as few private businesses as possible. Placing federal agencies in the district is a worthwhile convenience, but ultimately not a requirement; after all, one of the largest department headquarters, the Pentagon, is outside of even the modern-day District. The most important thing is to make sure that all Washington residents live outside of the district, so they can enjoy the enfranchisement benefit of statehood.

We're overlooking a few very important residents, though - the President and his or her family. Normally, this wouldn't be an issue, since Presidents are generally considered legal residents of their home state, only living in Washington due to a temporary work assignment. They continue to vote and pay state income tax in their home state. However, a President could arguably claim legal residency at the White House, especially if they did not maintain a home elsewhere. (Bill Clinton, for example, did not own any property in Arkansas during his Presidency, though he still claimed residency there.) Why does this matter? This is where my Constitutional caveat kicks in: the 23rd Amendment. This is the amendment that granted residents of the capital district the right to vote for President. Left intact, it could potentially allow the President (and the First Family) single-handedly wield three electoral votes in their own re-election or successor's election, a totally preposterous and abusive (and kind of hilarious) loophole. Repealing the 23rd would be the ideal solution to this problem, but in the meantime, we could get around it legislatively by just requiring the President to claim residency in their home state. (Even if a Washingtonian were elected, they would be a resident of the state of New Columbia, not the district, so no problem there.)

How would the state of New Columbia be organized? Given that the city of Washington would span across the entire state, it would probably make sense to have a consolidated city-state government, rather than have both a Governor and Mayor with overlapping responsibilities. This consolidated structure is already used on a smaller scale in some states, such as Virginia, where some cities are considered independent of any county and behave as counties unto themselves. Washington/New Columbia would be unique as a three-layer consolidation, acting as city, county and state government; though some authorities might be delegated to the equivalent of a city council. Washington would probably cede control of the new federal district back to Congress with a repeal of the DC Home Rule Act, creating an enclave that is within the city of Washington but is not a part of it.

Mail would be a minor issue to be resolved. There's no telling what New Columbia's postal abbreviation would be, since the logical one is already owned by my home state, North Carolina. They could save the Postal Service, and programmers everywhere, a lot of bother by just sticking with DC, even if it no longer stands for anything. (Whether the new federal district would keep the old name, despite the potential for confusion with the state, would be a question for Congress.) Whatever abbreviation the state uses, it would be easier for all involved if addresses within the new federal district followed the state's example. It wouldn't be unprecedented for the Postal Service to use addresses that don't follow their legal location; most people who live outside of any city limits will still put the nearest city in their mailing address.

Finally, of course, the U.S. flag would need to be updated. There are a lot of potential designs kicking around for 51 star flags (and even 52 stars, in case Puerto Rico is also admitted to the Union). Of course, as a scientician, I have my own idea...

There are a number of objections to the idea of DC statehood. The reason that the seat of government was settled in a federal district in the first place (after bouncing around Philadelphia, New York, and other cities for a quarter century) was for the federal government to provide for its own security, maintenance and operations. It's difficult to say what practical purpose that Washington's privately-owned outskirts serve in supporting these goals. I believe that the reduced-size district would be plenty capable of it.

The small size of would-be New Columbia gives rise to the concern that they would have outsized influence in national politics. With a population of more than 650,000, Washington is already larger than Vermont or Wyoming; you may as well complain about those states' influence, and that of all other small states (which is a legitimate issue, and one that I've covered before). And since DC already has three electoral votes under the current situation, their influence there would not change.

Lastly, there's the idea that because the state of New Columbia would be completely urbanized by the city of Washington, their influence may steer national policy away from rural interests. This has been an issue of contention since our nation was founded, and is one of the main reasons for some of our more peculiar approaches to (ir)representative democracy. However, in the modern-day political climate, it's been my observation that when someone talks about "urban vs. rural" interests, what they really mean is "liberal vs. conservative." It's clear that New Columbia would be a heavily Democratic state, which is a primary reason that Republicans in particular oppose the statehood movement. But if Washingtonians were predominantly conservative, I would still advocate for fair representation or statehood. The disenfranchisement of a population for political reasons has no place in the American experiment.