Much will be said and written over the coming days about the Republican Party's gain of the majority in the U.S. Senate. Certainly there are many reasons that 2014 is a good year for the GOP. For real and perceived reasons, many Americans are dissatisfied with the current state of affairs, and President Obama's approval ratings have been down lately (as many Presidents' ratings are after six years in office). But a degree of the Republicans' success can be traced to the geographical makeup of the open Senate seats, as well as historical events as recent as the 2008 election, and as distant and obscure as slips of paper drawn from a box back in 1789.
Every two years, one-third of the Senate's seats come up for election. To this end, the Senate is divided into three "classes," and in any given election, all of the seats in one of these classes are open. When the first Congress was elected, twenty Senators took their seats from the states that had thus far ratified the Constitution, but none yet knew how long they would serve; each was randomly selected, by drawing lots, to serve either a two, four, or six year term, creating the original classes. Since then, each state that has joined the Union has had their two Senate seats assigned semi-randomly to two of the three classes, in such a way to keep them roughly the same size.
The result is that in any election year, about two-thirds of the states will elect a Senator, and about a third will not (unless there's a special election to fill a vacancy). Each Senate class can be drawn on a map, indicating the states that will elect a Senator. Why does this matter? As we know, any state can be considered a "red," "blue," or "swing" state, and these random selections of geography mean that some classes are redder or bluer than others.
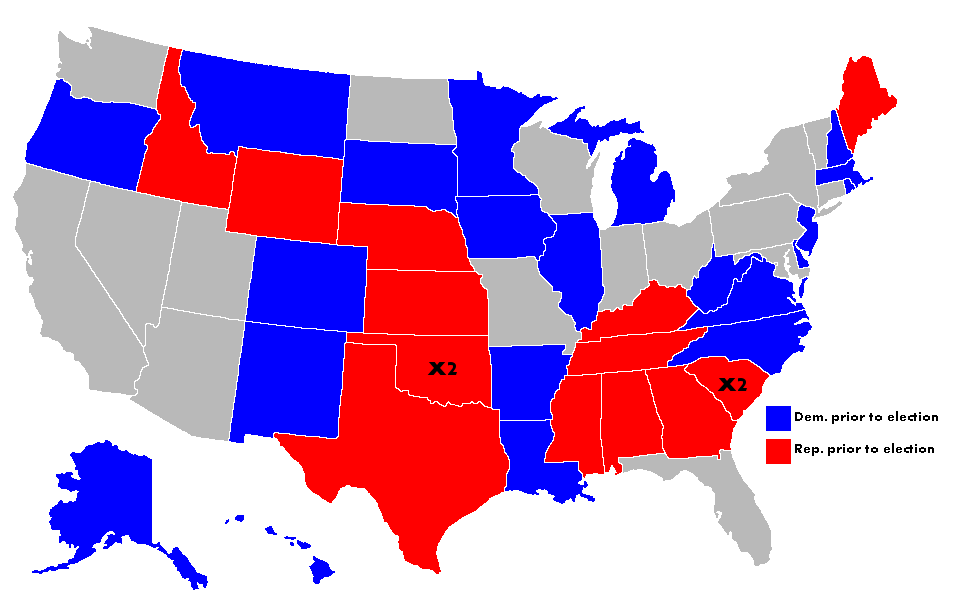
In 2014, Senate Class II was up for grabs. The map of the seats that were open look like this. The gray states had no seats up for election. Oklahoma and South Carolina had two open seats, due to special elections; Hawaii is not a member of Class II, but also had a special election.

But this map only shows what the class looked like before yesterday. The members of Senate Class II were previously elected six years ago, in 2008. Of course, we remember that 2008 was a Democratic wave year. President George W. Bush was deeply unpopular, the economy had just tanked, and Americans had become disillusioned with the wars in Iraq and Afghanistan. In this environment, Barack Obama's campaign struck a chord with many Americans, and many other Democrats were easily elected to office. As a result, Democrats held 20 of the 33 seats in Senate Class II, a significant increase from the 12 out of 33 they held prior to 2008.
We can get a sense of the "normal" partisan leanings of each state, and thus each class, by looking at their votes in the last several Presidential elections. For any given state, we can assume that if it gave its electoral votes to the same party in each of the last four elections (2000-2012), it is solidly red or blue; if it voted for one party three times, it leans toward that party but isn't quite solid; and if it voted for each party twice, it's a "purple" or swing state. By averaging out all of the states that had seats open in 2014, we can see just how purple the class is, compared to its previous and new makeup.
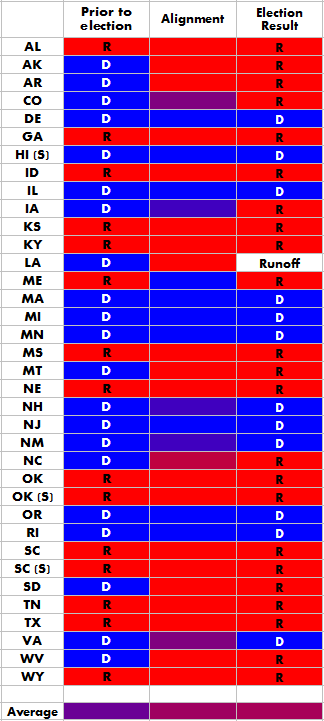
 To the right, each of the open seats (inlcuding special elections) are listed with the controlling party before and after the 2014 election. In the middle column is the state's average alignment, based on the last four Presidential votes. The solid red and blue states are obvious, while two states, Colorado and Virginia, are purple. A handful of states (IA, NH and NM) voted three times for the Democratic candidate and once for the Republican, and therefore are blueish, but with a hint of purple. North Carolina, on the other hand, is reddish, having voted for the Democrat one time.
At the bottom of each column, you can see the average color of all of the above cells. All are shades of purple, of course, befitting the grab-bag of red and blue states; but the shade is what matters. Our test of alignment estimates that this list of states (and yes, we're double-counting the states with two open seats) are, on average, aligned 62.5% with the Republican Party. Compare this to the 42% of these Senate seats that the Republicans held previously and the 65.7% that they will hold when the new Congress is seated in January (this figure excludes Louisiana, which we won't know the result of until the runoff next month; but assumes early results in AK and VA will hold). Thus, we can safely say that at least some of the Republicans' gains in Class II is a reversion to the mean.
What does this mean for the future? In 2016, Class III will be up for election. This class was last elected in 2010, which was nearly as much a wave year for Republicans as 2008 was for Democrats. The GOP didn't take the majority in the Senate, but they picked up six seats, to hold 24 of the 34 Class III seats. Using the same alignment test, we can estimate that Class III is 55% aligned with the Republican Party, still slightly on the red side but much more purple than Class II. Given that the GOP currently holds over 70% of the Class III seats, it's not unreasonable to expect them to lose a few in a couple of years, and quite possibly the majority along with them.
Looking further, Class I will come up for election in the futuristic space-year of 2018. This class is the bluest of all, with less than a 42% alignment with the Republican Party; but even so, the GOP may have a chance to reclaim some of their 2016 losses. Class I is currently only 24% Republican, so they may see some pickups in 2018.
